1. Describe Image Question

Answer
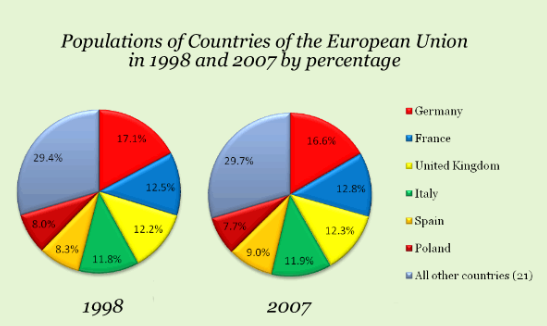
These pie charts compare the percentages of the populations of the countries of the European Union in 1998 and 2007. Besides 21 countries which are not specified and form a single category, Germany is the country which had the most population in both years: 17.1% in 1998 and 16.6% in 2007. Poland, on the other hand, had the least population in both years: 8.0% in 1998 and 7.7% in 2007. France held 12.5% in 1998 and 12.8% in 2007 -- which means its population slightly increased. The United Kingdom had 12.2% in 1998 and 12.3% by 2007. In general, most nation's populations increased at least a little.
Answer
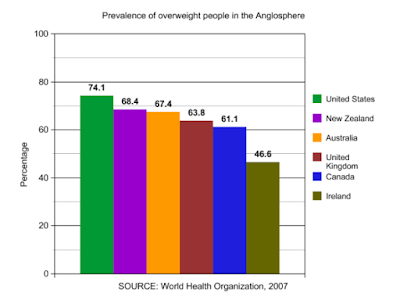
Obesity continues to be a major problem in many developed countries today. The highest percentage of obese are in the US at 74.1, followed by New Zealand at 68.4. Then come to Australia and the UK at 67.4 and 63.8 respectively. With 61.1% obese people, Canada stands 5th in the list and Ireland is a little far behind in the race with 46.6% of its population being obese.
3. Describe Image Question

Answer
This process diagram depicts the hydrological cycle. Through the transpiration process water from trees goes up in the air to form a cloud while the evaporation process water from oceans, rivers, lakes, and various water bodies go up in the air to form a cloud. Condensed clouds bring forth precipitation on earth. Though surface run-off rainwater goes to the ocean, rivers, lakes, and various water bodies while through underground run-off rainwater recharge aquifers. Through capillary action, trees draw underground water. The hydrological cycle indicates that the total volume of water remains the same in the system.
4. Describe Image Question

Answer
The bar chart illustrates information concerning the number of gold bars measured in thousands of millions of dollars that were imported in the period that goes from April of 2007 to March of 2011: from April 2007 to March 2008, 2,648 million dollars worth of gold bars were imported; from April 2008 to March 2009, 4,639.38 million dollars were imported; from April 2009 to March 2010, 7,474.43 million dollars were imported; and from April 2010 to March 2011, 8,275.63 million dollars worth of gold bars were imported.
5. Describe Image Question

Answer
The line graph compares the ratios between the earnings of young college graduates with college costs from 1991 to 2008. The earnings considered are of full-time workers, 25-34, with bachelor's only. The college costs include tuition, fees, and room and board at private 4-year institutions. As we can see, from 1991 to 1993, the ratios were pretty similar, whereas, in 2008, the earnings of college graduates were much less compared to college costs. The gap between both began widening in 1994, and, even though in the year 2000 things got better again for working graduates, the gap widened again from then on, favoring college costs.
Tips For PTE Describe Image.
- Let evaluate the PTE mock test and get scorecard feedback of your performances in all the PTE sections such as: speaking, writing, reading, and listening tests.
- Learn time management skills.
- Do continuous practice tests with our scored mock test and acknowledge yourself by knowing your level in the PTE exam.
- Get prepared before appearing in the PTE exam. 79Score.com mock tests will boost your confidence and get rid of your nervousness in the PTE Exam date.
To implement and reduce the mistakes in the real exam, you can also try the full-length PTE practice test at the 79Score.com platform. These PTE Practice tests will improve your overall fear of the exam and provide you the environment for nurturing your skills.


0 Comments